INTUITIVE GUI
The user interface facilitates setup, operation, analysis and report generation thus reducing the time and cost associated with the data acquisition process.
COMPREHENSIVE VISUALIZATION
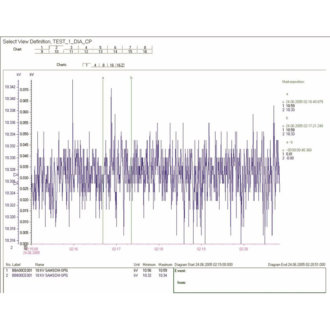
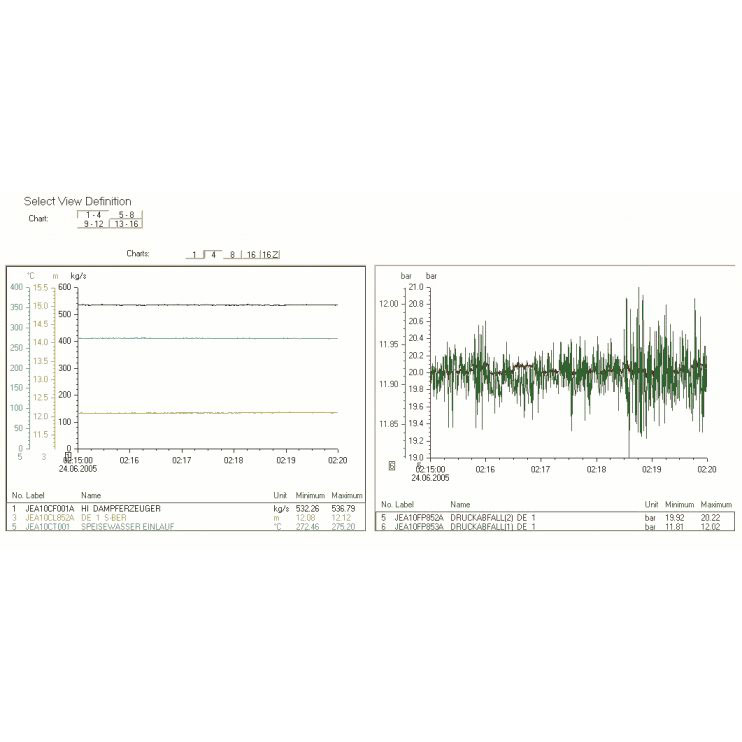
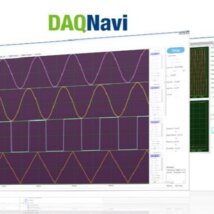
Freely design individual graphical interfaces for real-time measurement and visualization. Data channels are visualized by a simple mouse-click. As with the online data analysis, the measured values can be graphically displayed in a y/t- or y/x-diagram, as bar chart, tachometer or digital numbers. Standard displays, available with the click of a mouse, simplify setup.
REAL-TIME ALARM MONITORING AND LIMIT CHECKING
VTIcoda provides limit checking and alarm monitoring on every channel. Out-of-limit data is displayed in a separate window and logged.
SCALABLE FOR THOUSANDS OF CHANNELS:
The scalable architecture makes VTIcoda ideal for any test size from ten to ten thousand channels. High count systems can be easily configured and quickly ready to test.
EASY DATA REPLAY
Review events without affecting the live acquisition process. Adjustable forward and reverse makes replay easy. Specific channels of interest can be highlighted and isolated in separate windows.
REAL-TIME MATHEMATICAL FUNCTIONS AND DATA MANIPULATION
VTIcoda simplifies data manipulation tasks with a variety of standard built-in functions. Calculations are performed real-time, and the resultant channels can be treated like other measured channels for analysis and reporting purposes.
CLIENT/SERVER SYSTEM
The powerful client/server architecture allows shared use of acquired data, enabling several clients to have concurrent online access for data display and analysis operations. The online server approach also ensures reliable data archival and retrieval with integrated error diagnostics to guard against connection and data access issues

